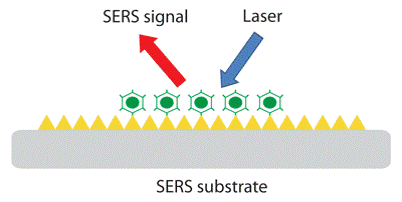
Raman spectroscopy is widely used in chemistry, materials, physics, polymer, biology, medicine, geology and other fields. Raman spectroscopy contains fingerprint information of the molecule, and Raman detection is simple, rapid and accurate. Therefore, Raman spectroscopy technology has great application prospects in detection. Surface-enhanced Raman scattering (SERS) is a phenomenon in which the Raman scattering signal of the detected molecule is greatly enhanced when it is adsorbed on the surface of rough metal nanostructures. SERS is related to the enhancement of electric field caused by local surface plasmon oscillation of metal nanostructures. With the help of SERS chip, the rapid detection of trace substances, even single molecule detection, can be realized.
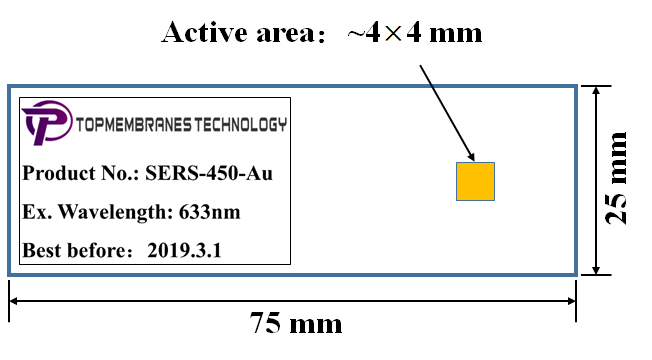
Figure 1. SERS chip structure diagram
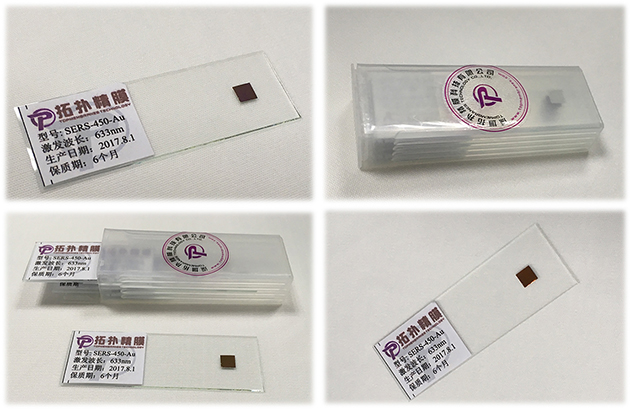
Figure 2. SERS chip photos
We fabricated gold nanostructures on porous substrates. The SERS chips made of gold material share highly uniform pore structure and nano-size microstructures,and have good stability and long shelf life as well. Solid-state SERS chips are usually attached to standard slide. As shown in Figure 1, the effective region is about 4 *4 mm, the matrix material is alumina, and the excitation wavelength is 633 nm. Based on SERS chip, trace substances can be rapidly analyzed. Typical applications include the detection of harmful substances (such as pesticides, illegal additives) in food, explosives and drugs, etc.
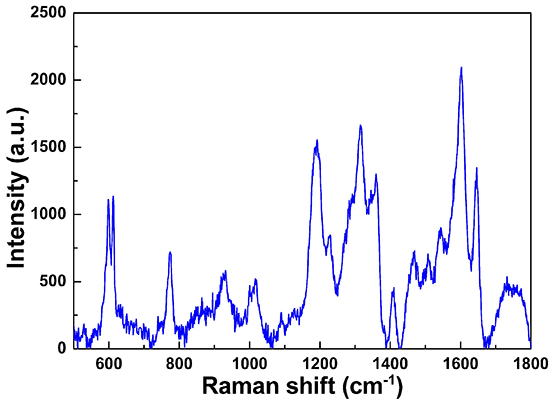
Figure 3. Raman spectra of R6G with a concentration of 10-6M under 633nm excitation
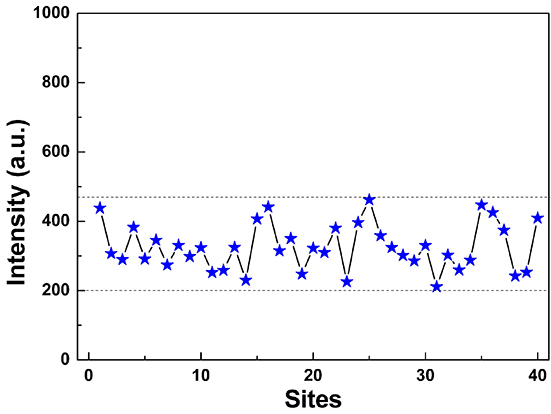
Figure 4. Raman intensity (@771cm-1) at different locations in the range of 5 *8cm
As an example, we have tested R6G molecule. SERS chip was immersed in R6G aqueous solution with concentration of 10-6 M for 10-30min, and then dried with nitrogen to test directly. The excitation wavelength is 633 nm, the laser power is 1.3 mW, and the integral time is 5 s. The typical Raman spectra are shown in Figure 3. Raman measurements were carried out at 40 locations of samples with an area of 5 *8 cm (before cutting). The test parameters are the same as those above. The Raman peak at 771 cm-1 changes with position as shown in Fig. 4.